It’s been a little over a week since my paper challenging hereditarianism was published in the American Journal of Physical Anthropology.1 Already some hereditarians have attempted a rebuttal. One in particular by John Fuerst2 warrants a response at least partially because it is a component of a preprint that somehow found its way onto Biorxiv.3 Fuerst makes a few key claims:
-
There is no evidence of stabilizing selection, which would make genetic differences smaller than I predict
-
Using broad-sense heritability (H2) instead of narrow-sense(h2) makes the difference larger and is a correct decision to make
-
Equation 4 in my paper is wrong and a better approach yields a higher estimate of how much genes may contribute to the IQ gap
-
Because of this, my paper actually agrees with hereditarianism.
I’ll address these points below.
Claim 1- No evidence of stabilizing selection
First, Fuerst claims that there is no evidence that stabilizing selection has occurred between Black and white population. This argument appears to be motivated by results from the model presented by Edge and Rosenberg (2015).4 The main finding of this paper plays a critical role in the logic of my paper. The authors demonstrate that “neutral trait differences are expected to have a magnitude comparable to the genetic differences at a single neutral locus” in other words the magnitude of group differences for a trait should match estimates of Fst, which are known to be comparatively small in humans. The authors argue later that divergent selection( where natural selection acts to make groups more different from each other) can produce phenotypic differences larger than neutral genetic differences and convergent selection (where natural selection acts to make populations more similar to each other) can produce phenotypic differences smaller than neutral diversity. This is represented in the figure below from Edge and Rosenberg (2015)
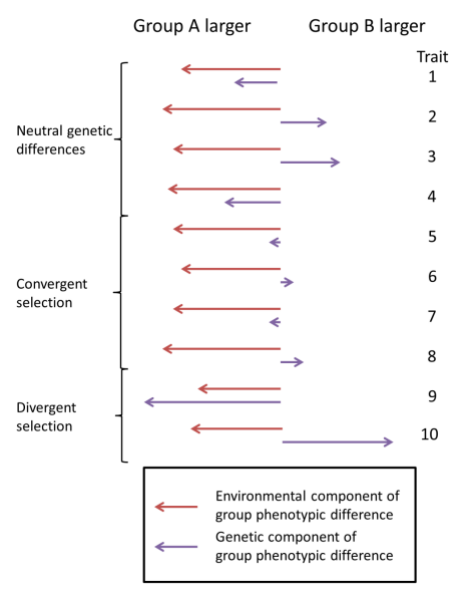
Now, Fuerst claims there is no evidence for this convergent selection on education or cognitive ability between Africans and Europeans. However, figure 3a of my paper does actually provide evidence for this kind of selection.
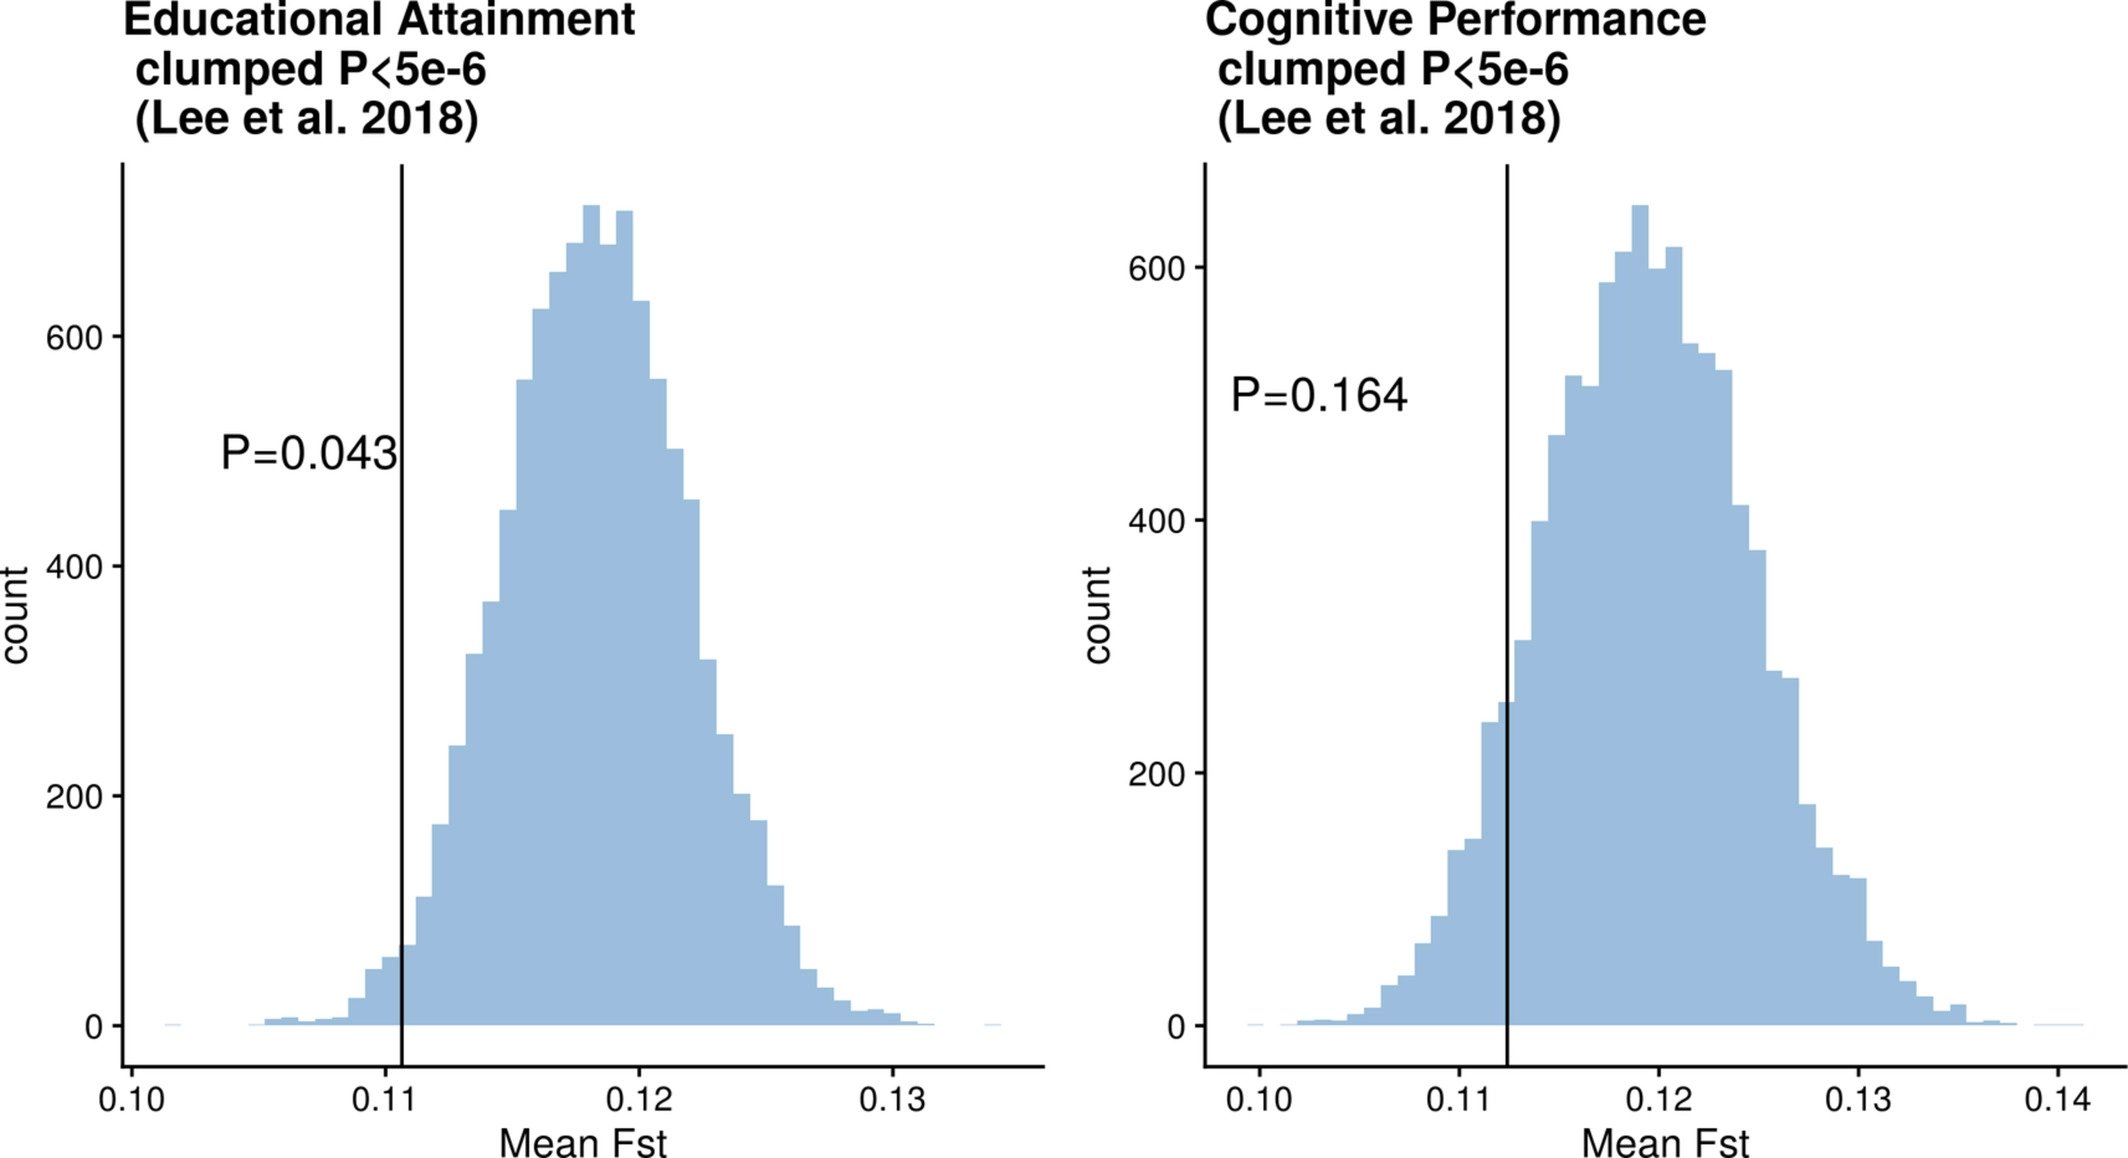
What that figure shows is that education associate variants are significantly less differentiated between Europeans and Africans than control variants not associated with educational attainment. One interpretation of this result is that natural selection has acted to make the frequencies of these genetic variants more similar. This finding is only putative and was not a main focus of my paper, but it’s important to point out that the evidence for convergent selection does exist and there is more evidence from my study for convergent selection than divergent selection.
Claim 2- Broad-sense heritability raises the genetic contribution
This argument is a surprisingly egregious one. Readers less familiar with heritability may benefit from diving into Jonathan Kaplan’s post on heritability.5 Briefly, in quantitative genetics there are two kinds of heritabilities. In plant and animal breeding, narrow-sense heritability is most often used. Narrow-sense heritability only includes additive genetic variation, that is, variation from alleles and their effects that are directly passed from parents to offspring. It’s additive genetic variation that is responsible for the resemblence of relatives and that can be used to predict the response to selection for a given population. On the other hand, broad-sense heritability is the proportion of all genetic variation associated with phenotypic variation, this includes additive genetic variation but also things like dominance and epistasis. These factors will make broad-sense heritability larger than narrow-sense but also less predictive and less applicable in genetic and evolutionary models.
Fuerst’s work relies mainly on an equation described by DeFries (1972).6 However he makes the same mistake that Arthur Jensen made by insisting on using broad-sense heritability. As DeFries explains to Jensen7, narrow-sense should be preferred over broad-sense for three reasons. First, it’s narrow-sense heritability that can be used to predict the traits of offspring based on parents. Second, that the larger broad-sense heritability estimates have led people to wrongfully advocate for eugenics. The third and most important reason is that the equation used by DeFries is based on additive genetic effects and it is not possible to empirically integrate epistasis and dominance into the model if broad-sense heritability were to be used. Fuerst is therefore misusing the equation by involving broad-sense heritability when other parameters in the equation are exclusively about additive variation only. It is also interesting that Fuerst makes a decision that results in a larger estimate despite the fact it is not theoretically justified or advised.
There are some other problematic and unjustified decisions made by Fuerst, one of which is the argument for scaling Fst based on Alcala and Rosenberg (2017)8. Fuerst in his equation 8 argues for the use of a maximum Fst of 0.7 based on Alcala and Rosenberg, but ignores that this is supposed to be an empirically observed value. The variants used in my study are not the genome-wide markers used to estimate that 0.7 value and so are ill-suited for this correction. If Fuerst wanted to do this correction properly he would need to empirically calculate the Fst max for the variants used in my study and scale by that factor. However, the issue of restricted Fst is most prominent for variants at low frequency, and GWAS do not typically detect variants at very low frequency because they require enormous sample sizes and great statistical power. In fact nearly 80% of the variants used to calculate mean Fst in my study have a minor allele frequency greater than 0.15, the point at which empirical analyses of the 1000 Genomes exome data have indicated constraint on Fst subsides. Likewise over 90% have minor allele frequency over 0.10 where constraint can be seen to be greatly reduced9. Overall it is not likely that Fst constraint is a major concern and it is certainly not the case that Fuerst’s “correction” is a proper course of action. Interestingly this is also a method with little justification that increases the genetic contribution.
Claim 3- My equation 4 is mistaken
Fuerst in a footnote implies my equation 4 is incorrect without any elaboration. Despite formatting and rendering issues in his derivation, I can clarify the difference between our two methods and why my approach ought to be preferred. Up until my equation 3 and Fuerst’s equation 11 our approaches are broadly equivalent and yield similar values with minor differences due to some decisions made by Fuerst in calculating his other parameters. These equations provide an additive among-group genetic variance, which can be compared to the among-group phenotypic variance to produce what would be equivalent to a “between-group heritability”. It is possible to move from this among-group genetic variance to an expected group phenotypic difference and this is where my and Fuerst’s methods differ. My goal was to estimate an expected difference, taking into account random effects from genetic drift as quantified by Fst. This randomness is incorporated by assuming a normal distribution, a safe assumption under neutral evolution10, and directly accounting for bias in the estimation of the expected group difference from the among-group variance that is introduced due to Jensen’s inequality11. Fuerst on the other hand, is not concerned with accounting for this bias and so produces an overestimate by simply multiplying the squareroot of between group heritability by the standard deviation.
That these two approaches are essentially identical can be demonstrated in a simple manner. Using my Fst value of 0.111 and a heritability of 0.35, Fuerst gets an estimated genetic contribution to the IQ gap of 8.85 (Table 1). If that value is multiplied by
$\sqrt{\frac{2}{\pi}}$
it equals 7.06.
Using the same heritability of 0.35 my equation 4. yields:
$2\sigma_B *\sqrt{\frac{2}{\pi}}$
$2*4.435 *\sqrt{\frac{2}{\pi}}$
$7.077236$
A nearly identical result. Because we are dealing with estimated values of among-group variance based on a model of random genetic drift it is reasonable, and preferable, to incorporate some of that randomness in the estimation of an expected value and not overestimate the group difference.
Ultimately though, Fuerst is squabbling over one or two potential IQ points which leads to the final claim.
Claim 4- My paper supports hereditarianism
On one hand it is difficult to know precisely what the hereditarian hypothesis regarding racial IQ differences is if you don’t do a little bit of digging. Authors frequently will rely on vague phrases like “the high heritability of intelligence suggests that large group differences might be at least partially genetically caused”.12 This also subtly implies the strawman argument from Rushton and Jensen (2005)13 that the anti-hereditarian position is exclusively 0% genetic contribution. Despite this, Jensen and Rushton conservatively state the hereditarian position is 50/50 genetics and environment13 but also that the “default hypothesis” ought to be that racial IQ differences are 80% genetic and 20% environmental.14 Alternatively Winegard, Winegard, and Anomaly (2020)15 argue that anything 20% of greater is consistent with the hereditarian hypothesis (this extremely broad claim came around for the first time suspiciously close to when I posted a preprint of my paper, arguing the racial IQ gap was no more than 20% genetic).
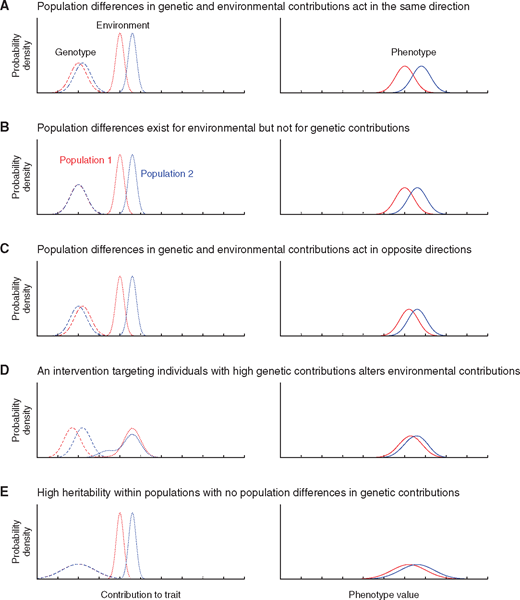
Under these conditions my results do not seem like a ringing endorsement of hereditarianism! The estimates from my paper, which I have defended from Fuerst’s objections, provides an upper bound of genetic contribution of 28% using an unrealistically high within-group heritability estimate. The more realistic within-group heritability values would range from 15% to 23% and because the method to estimate among-group variance makes assumptions that will overestimate genetic contribution, these values are almost certainly too high. Additionally the between group heritability, which has been a focus of the hereditarians for so long when argued to be on the scale of within-group heritability is less than 15%. So the hereditarian hypothesis, which is conservatively 50/50 is now overestimating the genetic contributions by at a factor of 2! The “default hypothesis” supported by Jensen, Rushton, and Intelligence editor-in-chief Richard Haier16 is at least overestimating genetic contribution by a factor of 4. Instead of 50/50 being a lower bound, it is now twice as large as the largest reasonable value genetics may contribute. Even worse, there is equal likelihood that genetics favors Africans over Europeans. While this is usually scoffed at by hereditarians because of the direction of the IQ gap it is perfectly reasonable for a neutrally evolving trait and it is perfectly possible that environmental disadvantage swamps genetic advantage, as portrayed by this figure from Rosenberg et al. (2019)17:
Compared to hereditarian claims, these results are far lower than suggested. They are also relatively uninteresting and insignificant compared to other sources of variation, despite references to arbitrary binnings of effect sizes into “medium” and “large” effects. The difference in test scores when an IQ test is immediately taken a second time exceeds this potential genetic contributions.17 So does the effect of a few additional years of education18, and even the range of IQ score differences that can exist between monozygotic twins!20 Considering that even these small contributions are likely overestimating the contribution of genes, and there’s no indication these genetic effects are intransigent to the environment, there doesn’t seem to be a need spend so much time and energy endlessly discussing the possibility of genetic contribution. Genes seem utterly inconsequential for race differences in cognitive performance.
Works Cited
2. John Fuerst “Insignificant” Differences
11. Wikipedia. Unbiased estimation of standard deviation. retrieved 02112021
20.Eric Turkheimer. Cochran on Zimmer and correcting an old misimpression.